
Campaign Management / Funnel Builder
Flow Analytics
Analyze the performance of landing pages and form flows with detailed metrics, visual charts, and financial insights.
Overview#
The Flow Analytics section offers a deep dive into how your campaign’s landing pages and form flows are performing. It consists of two primary tabs:
- Landing Page Analytics
- Form Flow Analytics
Each tab provides dynamic charts, performance metrics, and financial breakdowns to evaluate traffic quality, lead generation, and conversion success.
Landing Page Analytics#
1. Sources Overview Section#
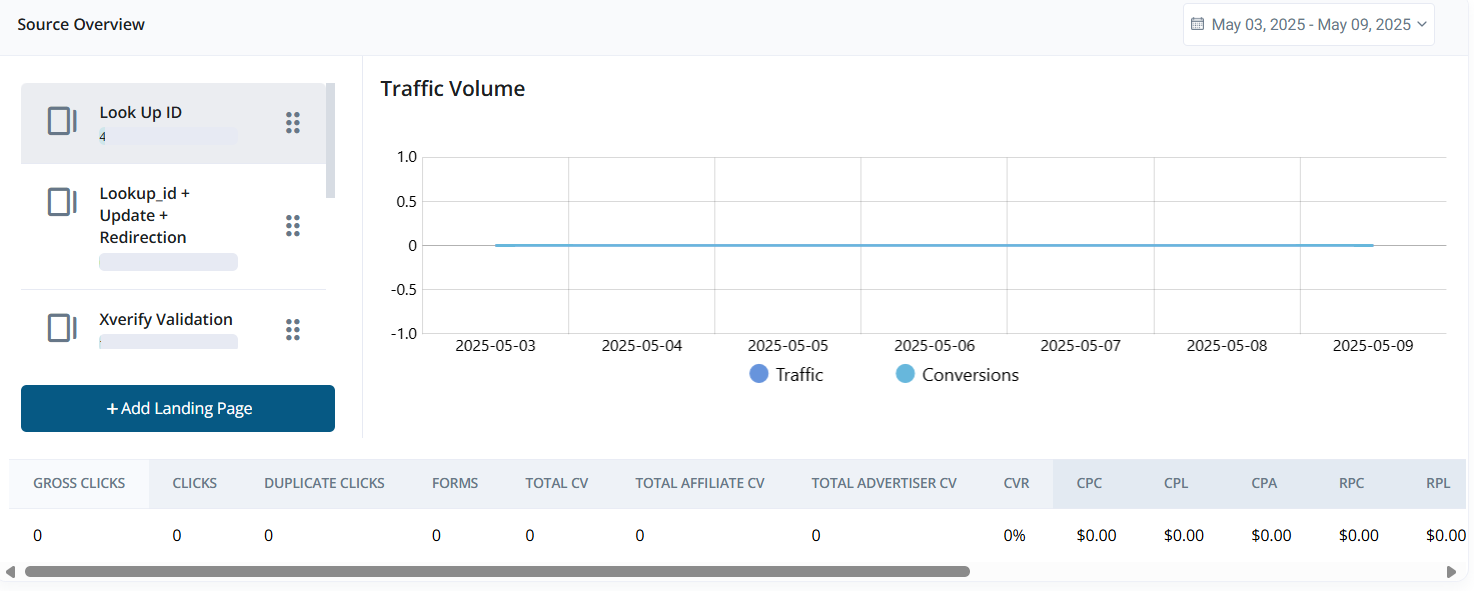
Left Panel
- Lists all available landing pages.
- Includes an Add Landing Page button for quick creation.
Right Panel (Line Chart)
- Displays a Traffic vs Conversions chart.
- The chart updates based on the selected landing page.
Metrics Table (Below Chart)
Includes metrics grouped into four categories:
-
Traffic & Click Data:
Gross Clicks, Clicks, Duplicate Clicks, Forms -
Conversion Data:
Total CV, Affiliate CV, Advertiser CV, CVR -
Cost & Performance Metrics:
CPC, CPL, CPA
RPC, RPL, RPA -
Financials:
Cost, Ad Spend, Payout, Revenue, Profit, Margin
All data is filtered by the selected date range.
2. Landing Page & Funnel Analytics Section#
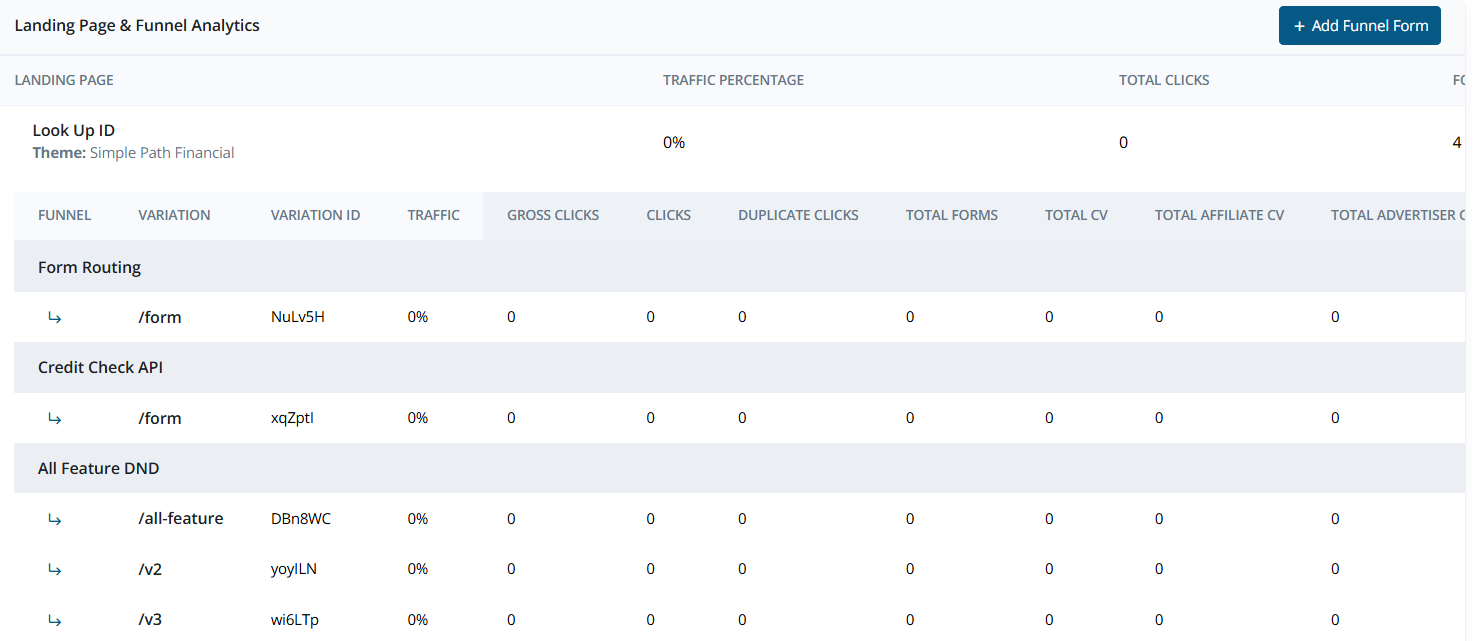
Displays high-level configuration and statistics:
-
Landing Page Details:
Lookup ID, Update behavior, Redirection type, Theme, Total Clicks -
Traffic Distribution:
Visual summary of how traffic is distributed
Includes an Add Funnel Form button to create a new form flow.
Funnel Form Flow Table
Displays variations of funnel forms with the following metrics:
- Traffic, Gross Clicks, Clicks, Duplicate Clicks
- Total Forms, Total CV, Affiliate CV, Advertiser CV
- CVR, CPC, CPL, CPA
- RPC, RPL, RPA
- Cost, Ad Spend, Payout, Revenue, Profit, Margin
Form Flow Analytics#
1. Sources Overview Section#
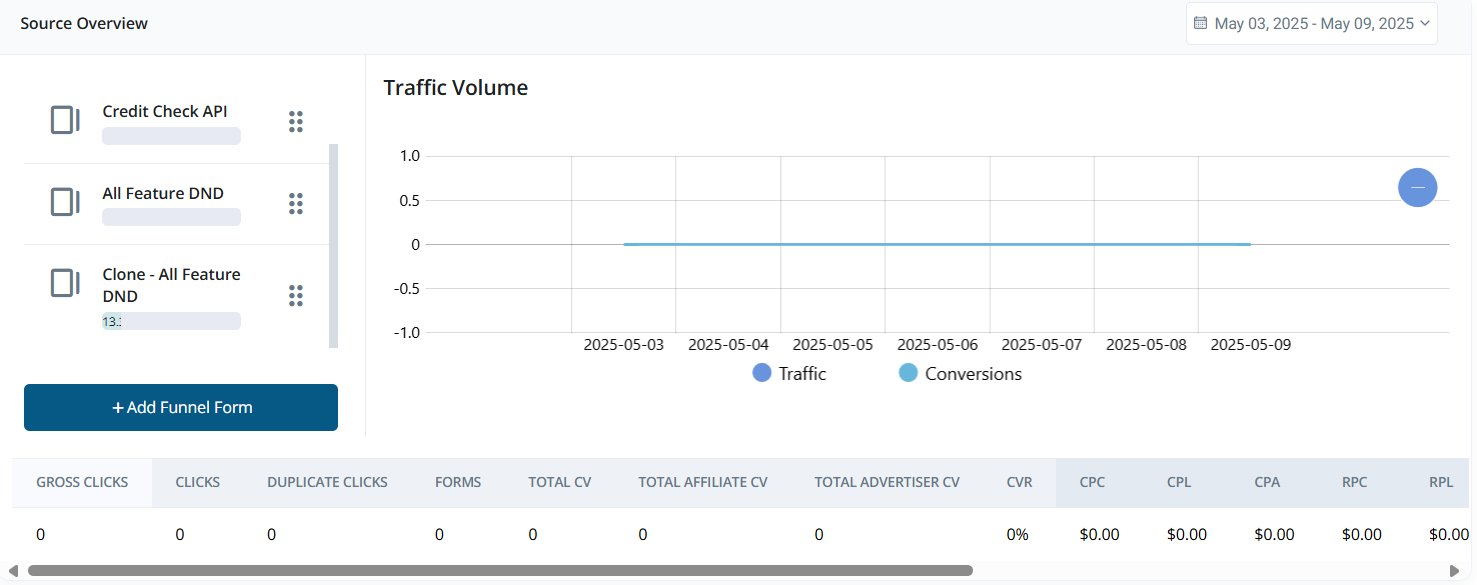
Left Panel
- Lists all available form flows.
- Includes an Add Funnel Form button.
Right Panel (Line Chart)
- Displays Traffic vs Conversions.
- Updates dynamically based on selected form flows.
Metrics Table
Detailed metrics for selected form flows:
-
Traffic & Click Data:
Gross Clicks, Clicks, Duplicate Clicks, Forms -
Conversion Data:
Total CV, Affiliate CV, Advertiser CV, CVR -
Cost & Performance Metrics:
CPC, CPL, CPA
RPC, RPL, RPA -
Financials:
Cost, Ad Spend, Payout, Revenue, Profit, Margin
2. Funnel Analytics Section#
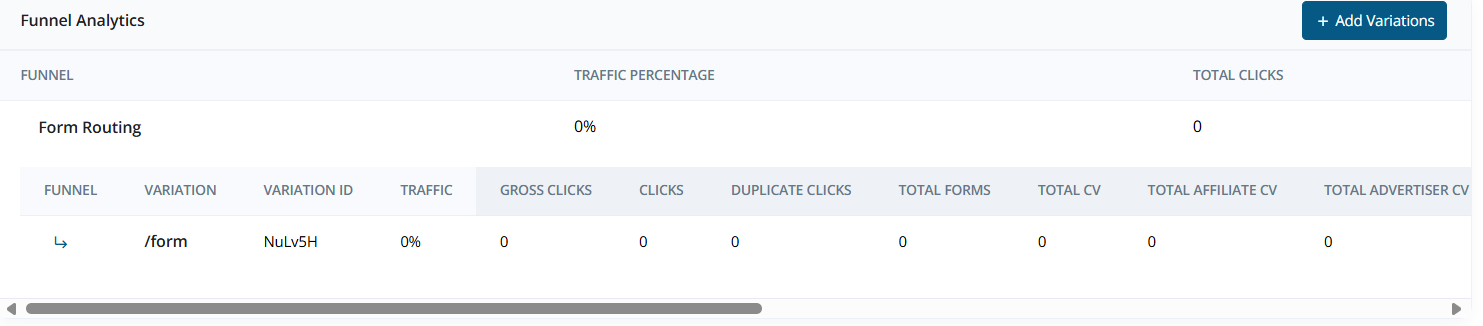
Displays configuration details and key metrics for selected funnel:
- Funnel Settings:
Form Routing, Total Clicks, Traffic Distribution
Includes an Add Variation button to add a new form variation.
Funnel Form Flow Table
- Variation, Variation ID
- Traffic, Gross Clicks, Clicks, Duplicate Clicks
- Total Forms, Total CV, Affiliate CV, Advertiser CV
- CVR, CPC, CPL, CPA
- RPC, RPL, RPA
- Cost, Ad Spend, Payout, Revenue, Profit, Margin
Tip: Use flow analytics to identify top-performing pages and optimize poorly performing variations.